What 8,760 Hours of Climate Data Reveals That a Design Day Can't
What 8,760 Hours of Climate Data Reveals That a Design Day Can't
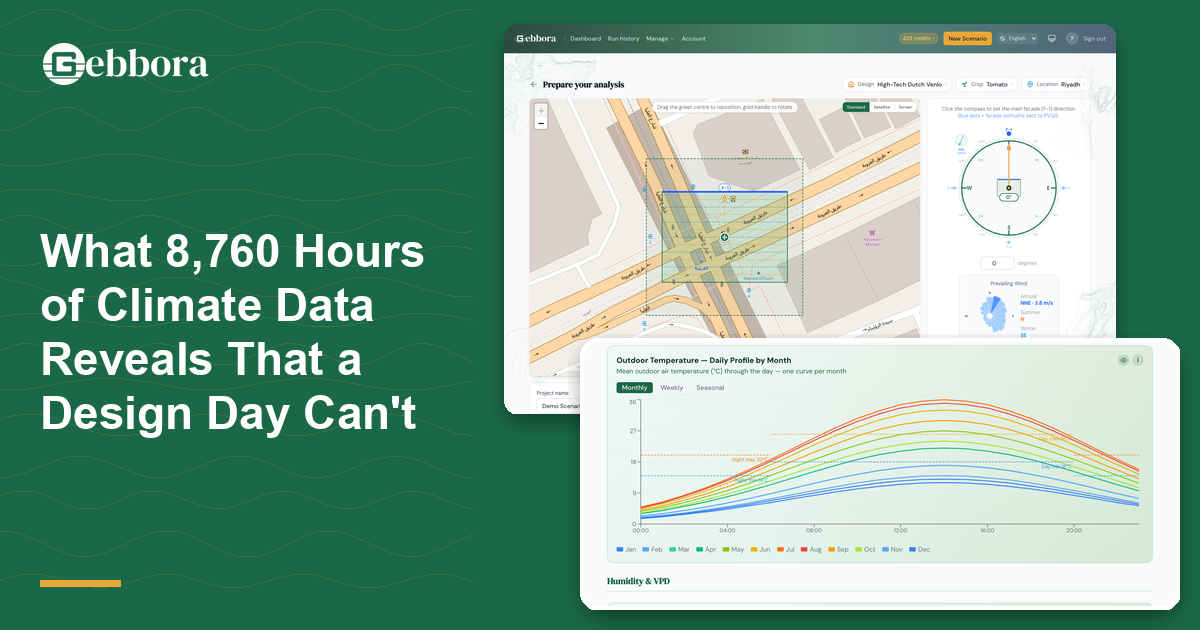
Twenty-four hours in a day. Three hundred sixty-five days in a year. That works out to 8,760 distinct thermal, radiative, and humidity states inside a greenhouse over twelve months. A design-day analysis gives you one of them.
When we built Gebbora Greenhouse Simulator, the single decision that shaped the most of the engine was committing to the full 8,760 from the start. Not a typical day per month. Not a representative week. Every hour, on the actual site, using satellite climate data.
This post is about what the extra resolution actually reveals, and why a greenhouse, unlike a conventional office building, will not let you average its way to a correct answer.
A design day is a snapshot. A greenhouse is a year.
The design-day method has a long, defensible history in HVAC engineering. Pick the coldest hour on record for heating sizing, the hottest for cooling, run a steady-state energy balance, and you have a number that prevents the equipment from being undersized. ASHRAE uses this framing for conventional buildings and it works because, in an office, a worst-case answer is most of the answer.
A greenhouse is different. The equipment matters, but the equipment is not the product. The product is a crop, and the crop spends every hour of its life integrating whatever climate the greenhouse hands it. Heat, light, vapour pressure deficit, CO₂, longwave loss to a clear night sky. Each of these is an accumulating dose, not a peak event. A design-day calculation can size a boiler. It cannot tell you whether the tomato crop hit its DLI target in February, or how often the cover condensed in October, or how many hours of foggers ran in August.
This is the same toolchain limitation we wrote about in our previous post on the simulation gap: the design tooling CEA inherited was built for buildings, and the gap shows up exactly where greenhouses differ from buildings. A greenhouse is not a worst-case problem. It is an accumulation problem.
DLI is cumulative. Peak irradiance isn't.
The clearest example is daily light integral. A tomato crop targeting 20 to 30 mol/m²/day needs that light delivered across 12 to 16 daylight hours. Peak irradiance at solar noon tells you how bright it gets at the brightest moment. It does not tell you whether the integral hit the target.
A mid-latitude unshaded glasshouse might see peak outdoor PAR around 1,800 µmol/m²/s at solar noon on a clear summer day, and still fall well below target DLI on an overcast February day. Same site, same crop, different month, different cloud cover. Peak alone is silent on the question that matters.
Hourly resolution is what makes this tractable. Saturation vapour pressure is exponential in temperature. Solar angles vary continuously through the year. Longwave radiation exchange depends on the fourth power of absolute temperature. The two methods most peer-reviewed greenhouse work runs on, FAO-56 Penman-Monteith and Stanghellini, are both written for an hourly timestep. They do not collapse cleanly to a daily average.
The credibility bar is set by validation studies. Acquah et al. (2018) showed the Stanghellini model tracking lysimeter-measured transpiration in a naturally-ventilated greenhouse at R² of 0.90 to 0.94. That accuracy depends on the model running at the temporal resolution the physics needs. A single-hour calculation cannot integrate any of this. An 8,760-hour simulation does.
Shoulder seasons are where the budget lives.
Heating and cooling equipment is sized for the worst hour. The bills are paid in every other hour. These are not the same problem.
In a typical Mediterranean-climate commercial greenhouse, the heating system might be sized for a 200 to 400 W/m² peak design load. In the operating year that follows, the boiler runs through 600 to 1,200 active hours, most of them on mild winter afternoons, autumn mornings, and spring evenings at 10 to 30 percent of peak. The annual fuel bill is the integral of those low-load hours, not the value of the peak.
A design-day calculation sizes the equipment and says nothing about the operating cost. An hourly simulation gives both: the peak that sizes the boiler, and the area under the curve that pays for it.
Count the stress hours, not just the peak stress.
The crop-side analogue is the same idea. A greenhouse that spends 40 hours per year above 35°C is a very different facility from one that spends 400 hours above 35°C, even if the hottest hour is identical. Tomato fruit set degrades above roughly 32°C. Heat-stress damage is a function of dose, not peak.
The same logic applies to VPD excursions outside the optimum band, to CO₂ starvation during tight winter ventilation, to low-DLI weeks where a shade cloth was left deployed by mistake, to humidity events that invite Botrytis. A design day reports peaks. An hourly simulation reports counts.
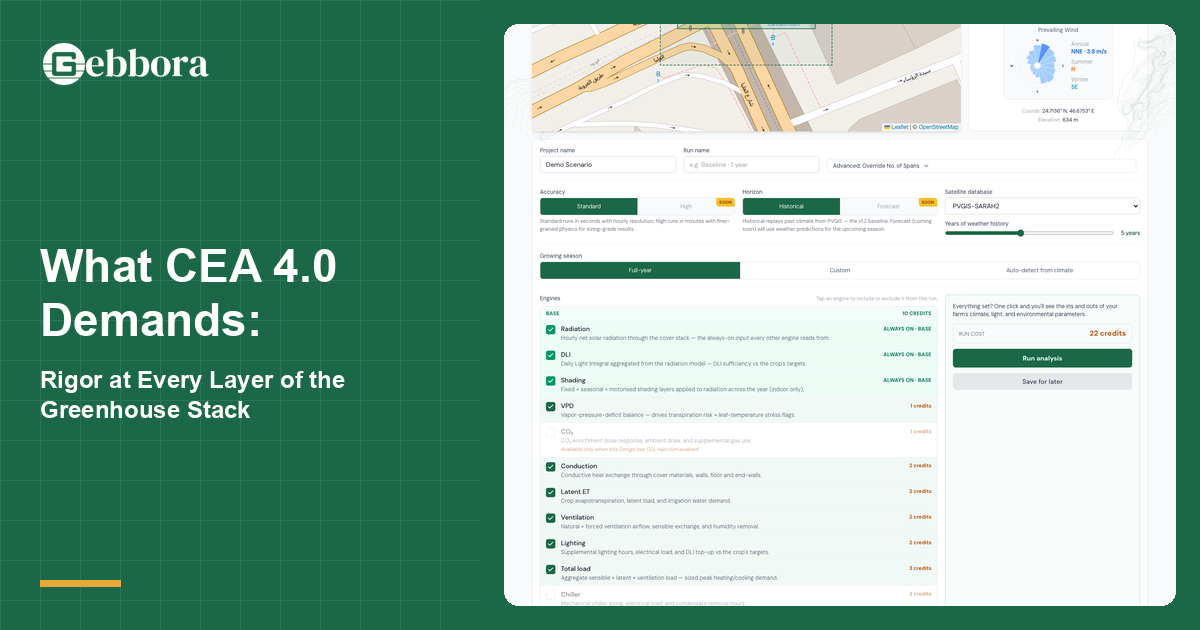
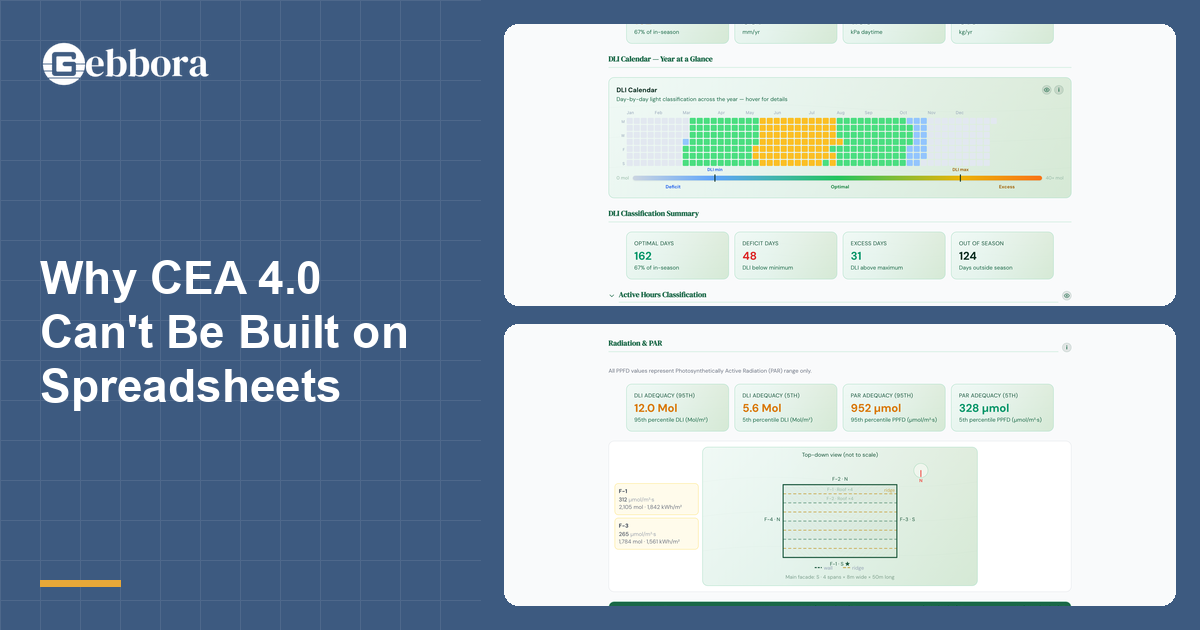
The outputs an 8,760-hour engine produces are not numbers a spreadsheet can approximate. Hours above 35°C per year. Hours below target DLI per month. Hours of fogger operation per season. Hours of supplementary lighting required to hit the integral. These are the metrics that decide whether the crop is healthy and the cost model is honest. They do not exist on a design day.
Hourly resolution is what makes the downstream models work.
A full year of hourly data is not the goal in itself. It is the input layer that lets every downstream model do its job correctly.
- Energy estimation error. Degree-day approximations and annual averages consistently miss on the shoulder seasons. Hourly integration removes that error class. On a typical northern-European glasshouse, a degree-day heating estimate can drift ten to twenty percent from the hourly answer depending on the year's cloud cover.
- Movable shading and energy-screen schedules. Screen manufacturers recommend deployment rules in plain language: deploy the energy screen below an outdoor temperature threshold, retract the shade screen when PAR falls below a target. An hourly simulation runs those rules against the site's actual climate and reports what they cost, what they save, and how often they conflict. A design-day calculation has no way to express a schedule at all.
- Cooling efficiency across the day. Fan-and-pad and fog effectiveness depends on outdoor humidity, which moves continuously through the day and the season. The same pad that delivers a 12°C temperature drop in dry afternoon air may deliver only 3°C in humid pre-dawn conditions. The annual-average view hides this. The hourly view costs the auxiliary cooling the pad cannot cover.
- Plant growth predictions. A growth model takes hourly PAR, temperature, VPD, and CO₂ as input and integrates a daily biomass increment. Anything coarser than hourly forces the growth model to skip days or extrapolate, both of which compound across a season. This is on Gebbora's roadmap as a forthcoming engine module.
8,760 hours of climate data comes from satellites, not weather stations.
Once an engine commits to hourly resolution, the question becomes where the input data actually comes from. Most greenhouses do not have a weather station next door, and the ones that do often do not have a station with the full set of radiation, temperature, humidity, and wind variables a simulation needs.
The answer is satellite reanalysis and public weather APIs. Three datasets do most of the work.
PVGIS, the Photovoltaic Geographical Information System run by the EU Joint Research Centre, gives hourly time-series at roughly 1 km² resolution for most of the inhabited world. It was originally built for solar-PV feasibility, which means it is calibrated for exactly the irradiance, temperature, and clear-sky modelling a greenhouse engine needs. Reference: ec.europa.eu/pvgis.
ERA5 is the ECMWF Copernicus reanalysis, covering 1940 to present at hourly resolution on a roughly 31 km global grid, with full coverage of wind, precipitation, soil temperatures, and radiation components. It is the reference dataset for sites or variables PVGIS does not cover. Reference: cds.climate.copernicus.eu.
Open-Meteo is the next dataset Gebbora is integrating. It exposes a unified hourly schema that spans three regimes most projects need separately: ERA5 and ERA5-Land reanalysis back to 1940, ECMWF IFS forecasts going forward, and CMIP6 HighResMIP climate projections downscaled to 10 km, running through 2050. The payoff is direct: a feasibility study being done today on a site that needs to operate for the next twenty years can simulate the 1990s climate, the recent decade, and the projected 2040s climate without switching tools or schemas.
The Simulator draws on all three: PVGIS as the default for global coverage, ERA5 for sites or variables PVGIS does not reach, and Open-Meteo for the full timeline from historical reanalysis through 2050 climate projections. The barrier to using these datasets at hourly resolution has been engineering, not access.
What 8,760 hours looks like in practice.
A full-year simulation does not return a single number. It returns shapes.
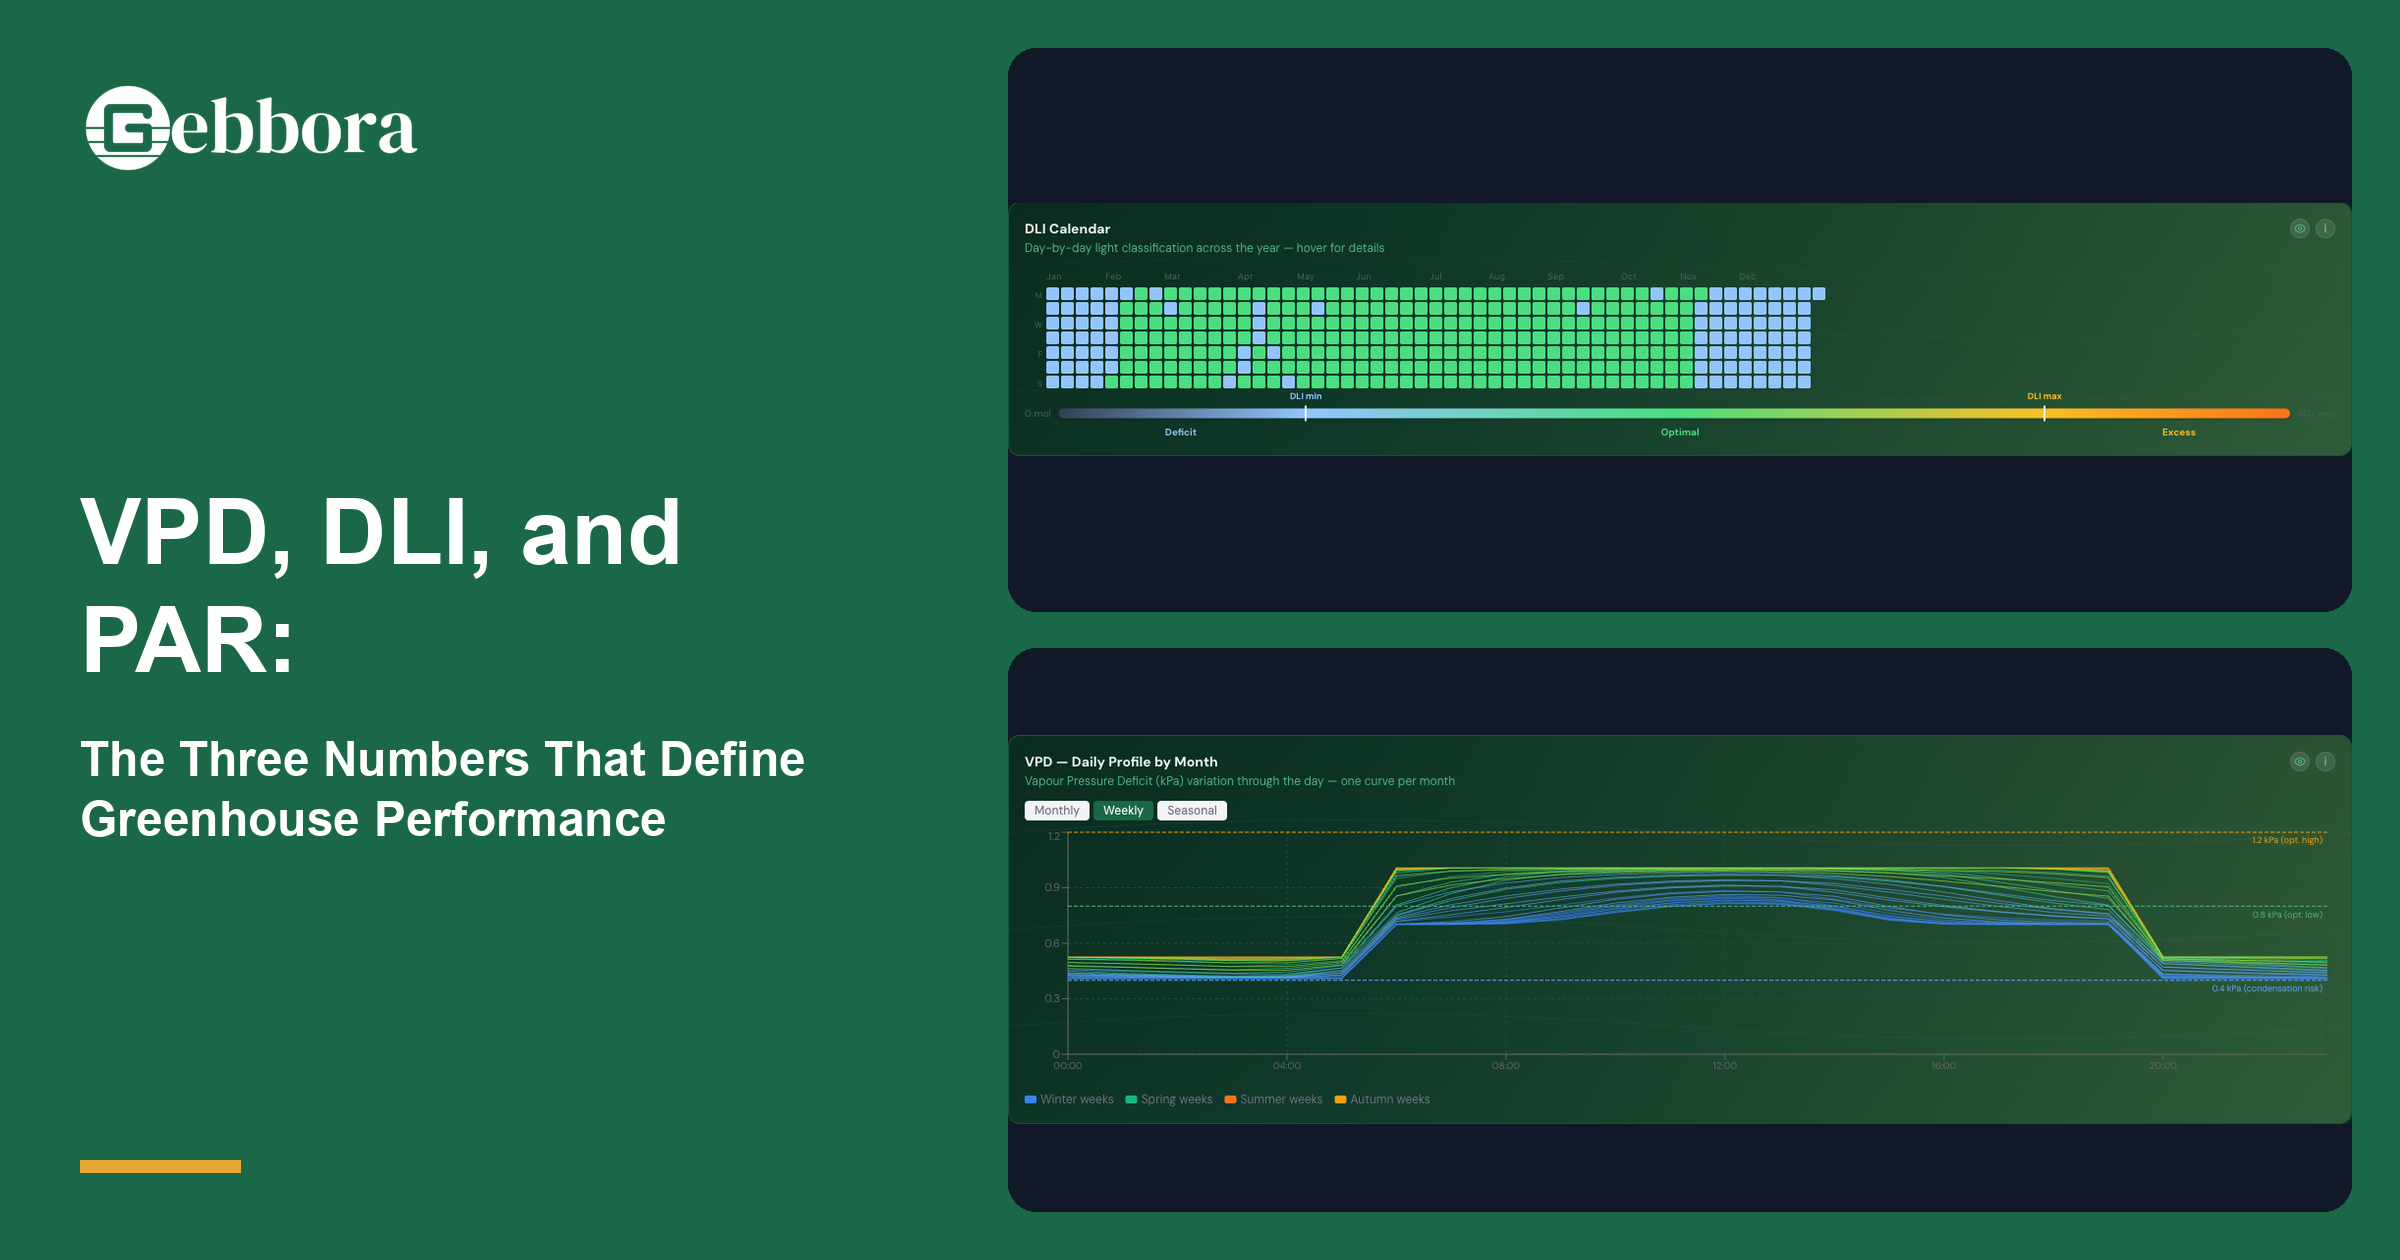
A DLI calendar heatmap with twelve rows and thirty-one columns, every day of the year coloured by daily integral, so the months below target are visible at a glance. An energy-load curve with shoulder-season detail. A stress-hour histogram counting the hours above 35°C, below the dewpoint, beyond the VPD optimum. A transpiration integral by month that feeds into irrigation design.
These are the outputs a design-day calculation cannot produce. In future posts we will go into what the specific 8,760-hour outputs tell you, starting with VPD, DLI, and PAR. A parallel pillar essay takes up the broader argument about what this rigor-first orientation means for the next decade of CEA design.
For now, the point is just the asymmetry. One hour versus 8,759. A greenhouse lives its life one hour at a time. The simulation should too.