VPD, DLI, and PAR: The Three Numbers That Define Greenhouse Performance
Search for VPD, DLI, or PAR and the first page of results assumes you are growing in a tent under an LED. Run the same search as someone sizing a ten-hectare glass house, designing a multi-tier plant factory, or evaluating an open-field plot, and the answers are off by an order of magnitude. Three numbers anchor the conversation in every one of those operations: VPD (the gap between how much water vapor the air holds and how much it could), PAR (the slice of the solar spectrum a plant can actually use), and DLI (the daily integral of PAR over the photoperiod).
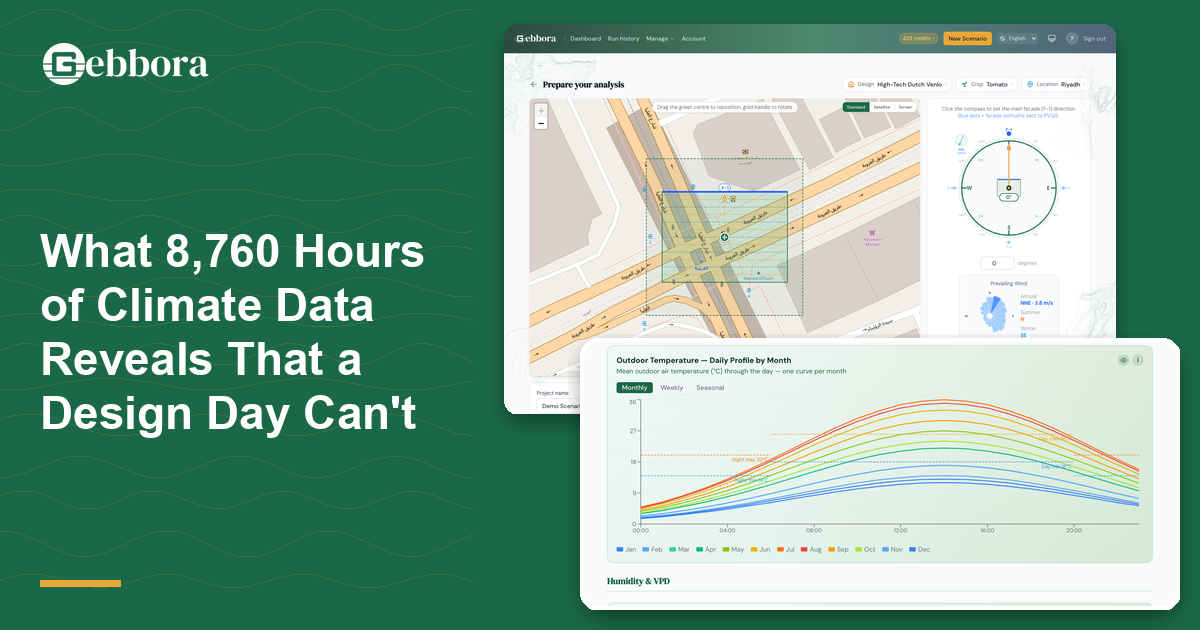
Performance is set by where the three sit relative to each other, and the cleanest way to see that overlap is the hourly resolution that integrates all three.
VPD: what the air is demanding of the plant
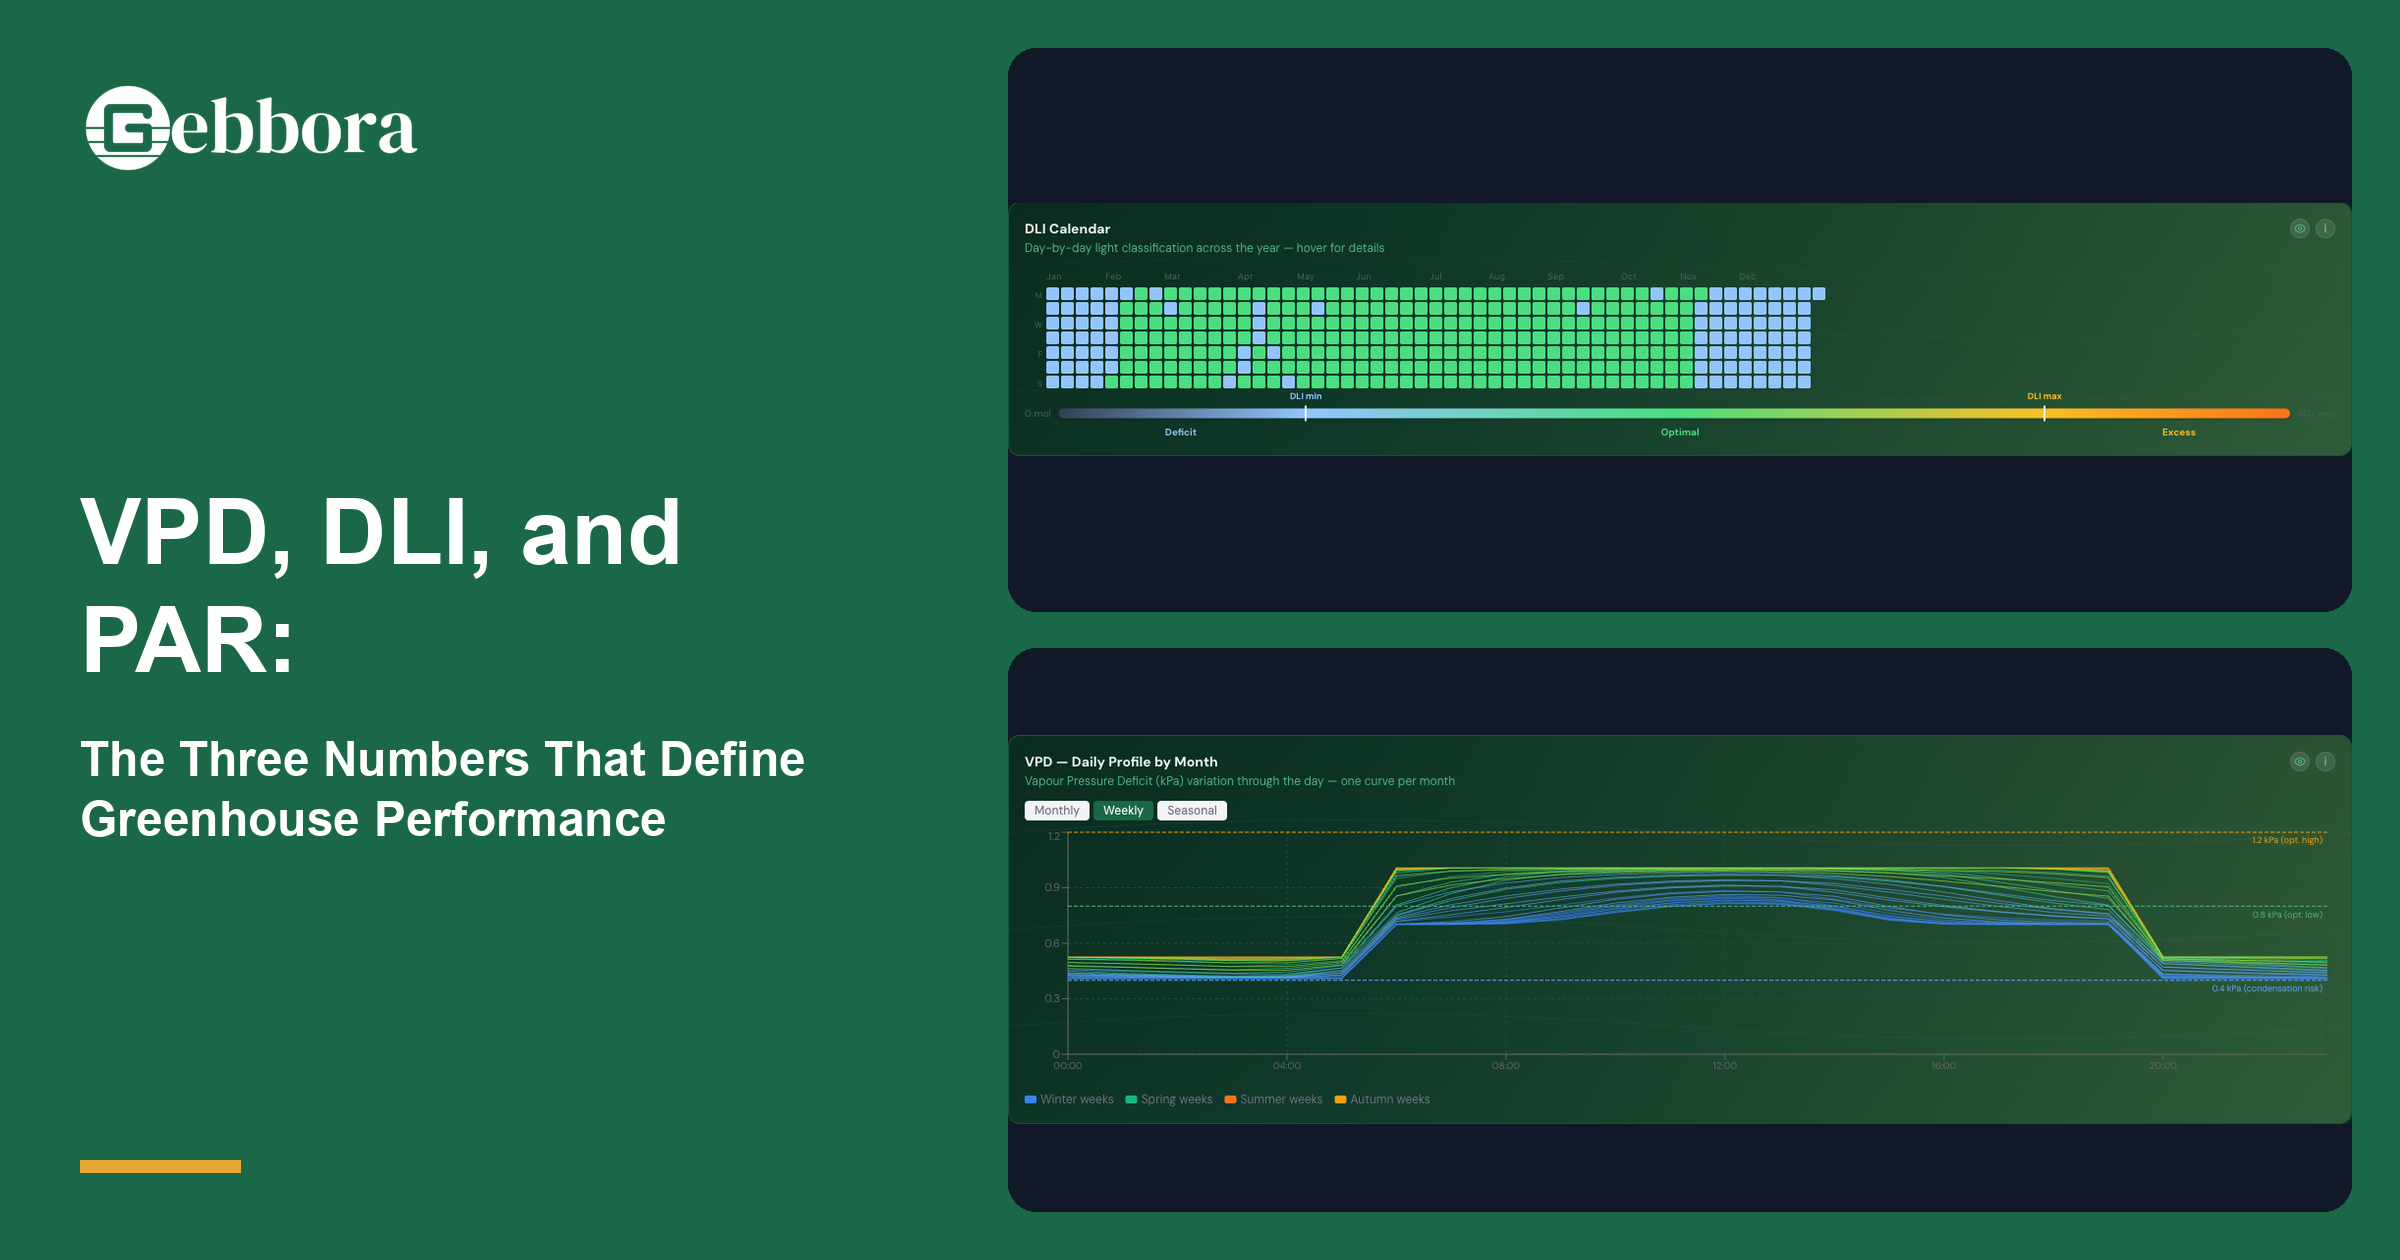
Vapor pressure deficit is the gap between how much water vapor the air is currently holding and how much it could hold at saturation, reported in kilo Pascals (kPa). High VPD pulls water out of the leaf; low VPD lets transpiration slow, condensation rise after dark, and disease pressure follow. For most crops the operational window is roughly 0.4 to 1.6 kPa, with stomata closing under high VPD to defend against water loss (Bertin & Heuvelink, 1993) and yield and disease losses accumulating under sustained low VPD (Grange & Hand, 1987).
The trap a single-number target hides is that VPD depends exponentially on temperature, through the Magnus or Tetens approximation of the saturation curve (Allen et al., 1998). A 25°C / 70% RH setpoint and a 30°C / 70% RH setpoint look identical on a controls panel; the VPDs are roughly 30% apart. The right question is never "what humidity?" -- it is "what VPD across the day?"
The same number reads differently across operations. In a glass house VPD is a defended target, with humidity, temperature, and ventilation acting together. In a plant factory it is a designed set-point held to the same value on every tier. In open-field production VPD is whatever the sky gives you, and the operator's lever is choosing a crop and a season whose VPD tolerance fits the climate (Stanghellini, 1987; Acquah et al., 2018).
PAR: the slice of the spectrum a plant can use
Photosynthetically active radiation is the 400 to 700 nanometre band of the solar spectrum -- visible light, in practice -- and it is the only slice a chloroplast can drive photosynthesis with. The instantaneous metric is PPFD, photosynthetic photon flux density, reported in µmol/m²/s. A pyranometer reading in W/m² tells you total solar radiation; a PAR sensor tells you what the plant can use (McCree, 1972; Sager et al., 1988). Sunlight runs roughly 4.6 µmol/J across the PAR band, but the conversion changes with the source -- sunlight, high-pressure sodium, white LED, and red-blue LED all sit at different points (Bugbee, 2016).
Where PAR matters depends on the operation. In a glass house it sits at the cover spec: compare the cover material's PAR transmission percentage, not the catalogue's "% light transmission" -- the two diverge for diffusing covers and spectrum-selective films (Pollet & Pieters, 2000). In a vertical farm it sits at the lamp spec: efficacy is reported in µmol/J, and two lamps with identical wall-plug wattage can deliver thirty to fifty percent different PPFD at the canopy (Mitchell, 2022). In open-field production PAR is the bounding metric for what is achievable without intervention. That sets up DLI directly: PPFD is the instantaneous flow rate, DLI is the integral of PPFD across the day.
DLI: the day's light bank
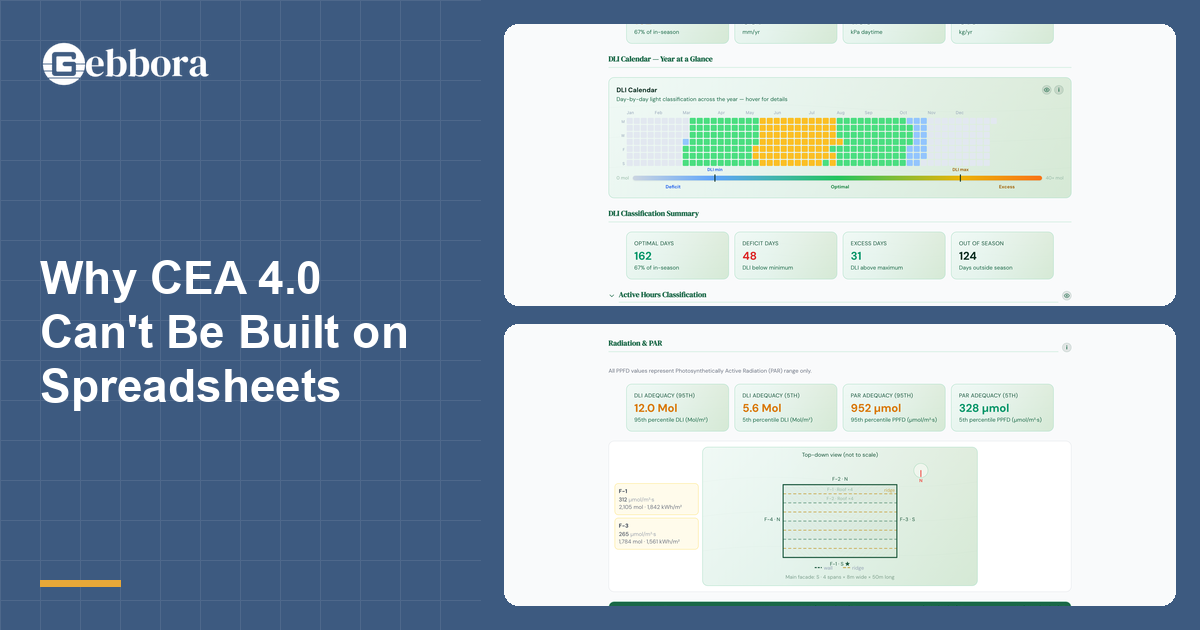
Daily light integral is the total quantity of PAR photons that arrive on a square metre over a full day, reported in mol/m²/day. If PPFD is a flow rate, DLI is the total volume in the tank by sundown. The plant cares about volume. Useful targets by crop category, sourced rather than invented:
- Leafy crops (lettuce, basil, herbs): 10 - 17 mol/m²/day (Faust & Logan, 2018; Both et al., 2017).
- Fruiting vegetables (tomato, cucumber, pepper): 22 - 30 mol/m²/day (Faust & Logan, 2018).
- Strawberry: 17 - 22 mol/m²/day (Hidaka et al., 2014).
Vertical-farm leafy systems typically operate at the lower band or just above, where the energy cost per yield curve flattens (Kozai, 2013). The trap a peak-irradiance reading hides is that DLI integrates over daylight hours. A bright noon on an overcast day with three useful hours can still miss target -- the same case 8,760 hours of climate data make against a static design-day analysis.
DLI reads differently across operations. In a glass house it is a function of geometry, cover material, latitude, and season, with supplemental lighting and dynamic shading as the operator's levers (a future post will go deeper on dynamic shading). In a vertical farm DLI is a designed set-point, which is why USA DLI maps exist in the first place: when nothing is inherited from the sky, the operator has to choose a DLI rather than measure one (Korczynski, Logan & Faust, 2002). In open-field production DLI is a climate-suitability metric, and Faust and Logan's 2018 high-resolution DLI atlas was built so growers could compare candidate sites against crop requirements before planting (Faust & Logan, 2018).
Why the three move together
High light raises leaf temperature, which raises VPD when humidity is held flat. Transpiration cools the leaf, but only if VPD is in range and water is available. When any one of the three slips out of band, the other two stop compensating.
A Mediterranean glass house at summer noon sees outdoor PPFD near 1,800 µmol/m²/s; if the cover transmits roughly 65% of PAR, inside PPFD lands near 1,170. Leaf temperature climbs, and with ventilation tight and humidity above 80%, VPD can drop below 0.5 kPa, stomata stay open, transpiration over-runs, and post-dusk condensation risk rises.
A multi-tier vertical farm at an 18-hour photoperiod and a designed PPFD of 250 µmol/m²/s integrates to a DLI near 16.2 mol/m²/day, square in the leafy-greens band; lamp heat raises air temperature, and the HVAC sized for that lamp load is usually the largest single capital line item.
A mid-latitude spring sowing in open field may sit at a March DLI near 15 mol/m²/day, low for a fruiting tomato target above 22; the practical lever is sowing date or transplant timing, not a climate-control fix. The operation is a co-design of all three, and the lever depends on which kind of operation it is.
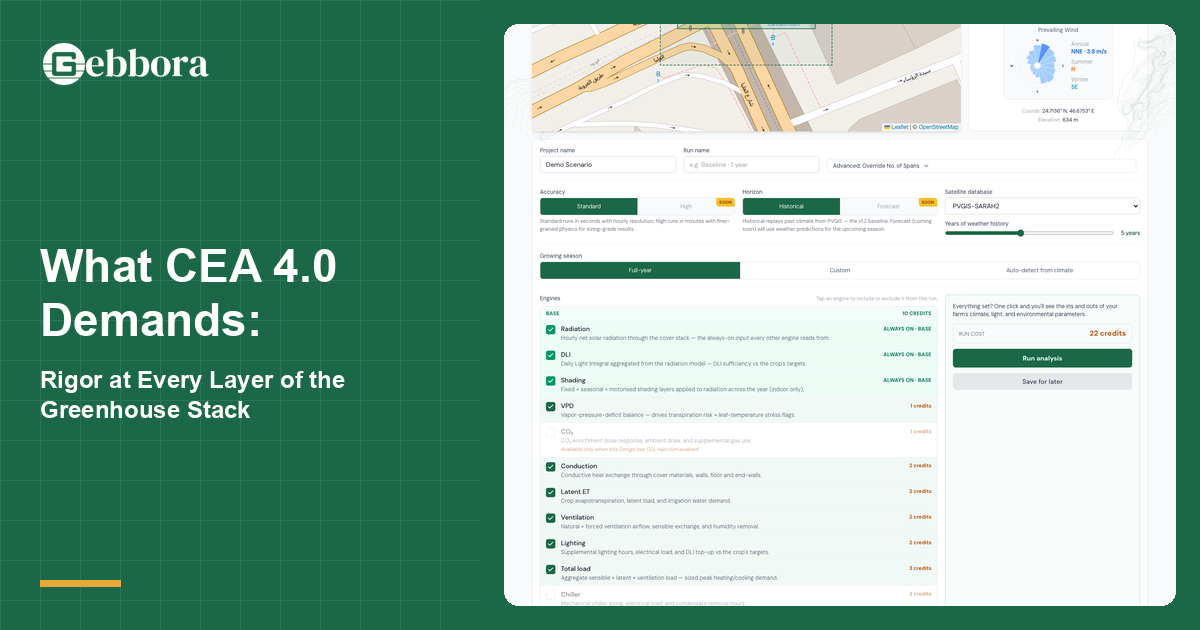
What the Gebbora Greenhouse Simulator surfaces
The Gebbora Greenhouse Simulator produces three outputs that map directly onto the three numbers, in the same order this post treats them. A VPD daily profile by month surfaces four seasonal envelopes on a kPa axis with reference lines at 0.4 kPa (condensation risk), 0.8 kPa (apex low), and 1.2 kPa (apex high). A PAR transmission profile reports the cover material's spectral transmission weighted across the photoperiod, alongside the resulting daylight-hours PPFD. A DLI Calendar shows a 365-day classification heatmap with Deficit, Optimal, and Excess bands and DLImin and DLImax markers across the year.
The Simulator does not invent ideal VPD, PAR, or DLI targets per crop. It surfaces what your geometry, climate, cover material, and scheduling will actually produce, so the operator -- agronomist, grower, consultant, or investor -- can compare against the targets they already work from. The same physics layer feeds Gebbora Companion (field-ops and sensors for open-field and protected production), Gebbora Numbers (financial feasibility), and Gebbora CAD (the construction designer for greenhouse builds); the three numbers feed every product. The Simulator lives at sim.gebbora.app.
Three numbers, eight thousand hours, one operation. Whether glass house, vertical farm, or open field, the performance lives where the three overlap.
Frequently asked questions
What is the difference between PAR and PPFD? PAR is the 400 to 700 nanometre band of the spectrum -- a region of light. PPFD is the measurement of how many PAR photons arrive on a square meter per second, reported in µmol/m²/s. PAR names what counts; PPFD measures how much of it is arriving right now.
How do I calculate VPD from temperature and humidity? Compute saturation vapor pressure at the air temperature using the Magnus approximation, multiply by (1 minus relative humidity as a decimal), and report in kPa. At 25°C, saturation vapor pressure is about 3.17 kPa; at 70% RH, VPD is 3.17 × (1 - 0.70) = 0.95 kPa. The FAO-56 reference (Allen et al., 1998) gives the canonical form.
What DLI does a lettuce crop need? Most commercial lettuce production targets 12 to 17 mol/m²/day; below about 10 the crop slows, and above 20 tip-burn and bolt risk rise (Both et al., 2017; Faust & Logan, 2018). Vertical-farm operators usually sit at the lower end to keep energy cost per kilo of yield down.
References
- Acquah, S. J., Yan, H., Zhang, C., Wang, G., Zhao, B., Wu, H., & Zhang, H. (2018). Application and evaluation of Stanghellini model in the determination of crop evapotranspiration in a naturally ventilated greenhouse. International Journal of Agricultural and Biological Engineering, 11(6), 95-103.
- Allen, R. G., Pereira, L. S., Raes, D., & Smith, M. (1998). Crop evapotranspiration -- guidelines for computing crop water requirements. FAO Irrigation and Drainage Paper 56. Food and Agriculture Organization of the United Nations.
- Bertin, N., & Heuvelink, E. (1993). Dry-matter production in a tomato crop: comparison of two simulation models. Journal of Horticultural Science, 68(6), 995-1011.
- Both, A. J., Bugbee, B., Kubota, C., Lopez, R. G., Mitchell, C., Runkle, E. S., & Wallace, C. (2017). Proposed product label for electric lamps used in the plant sciences. HortTechnology, 27(4), 544-549.
- Bugbee, B. (2016). Toward an optimal spectral quality for plant growth and development: the importance of radiation capture. Acta Horticulturae, 1134, 1-12.
- Faust, J. E., & Logan, J. (2018). Daily light integral: a research review and high-resolution maps of the United States. HortScience, 53(9), 1250-1257.
- Grange, R. I., & Hand, D. W. (1987). A review of the effects of atmospheric humidity on the growth of horticultural crops. Journal of Horticultural Science, 62(2), 125-134.
- Hidaka, K., Dan, K., Imamura, H., Miyoshi, Y., Takayama, T., Sameshima, K., Kitano, M., & Okimura, M. (2014). Effect of supplemental lighting from different light sources on growth and yield of strawberry. Environmental Control in Biology, 52(2), 63-71.
- Korczynski, P. M., Logan, J., & Faust, J. E. (2002). Mapping monthly distribution of daily light integrals across the contiguous United States. HortTechnology, 12(1), 12-16.
- Kozai, T. (2013). Resource use efficiency of closed plant production system with artificial light: concept, estimation and application to plant factory. Proceedings of the Japan Academy, Series B, 89(10), 447-461.
- McCree, K. J. (1972). The action spectrum, absorptance and quantum yield of photosynthesis in crop plants. Agricultural Meteorology, 9, 191-216.
- Mitchell, C. A. (2022). History of controlled-environment horticulture: indoor farming and its key technologies. HortScience, 57(2), 247-256.
- Pollet, I. V., & Pieters, J. G. (2000). PAR transmittances of dry and condensate covered glass and plastic greenhouse cladding. Agricultural and Forest Meteorology, 110(4), 285-298.
- Sager, J. C., Smith, W. O., Edwards, J. L., & Cyr, K. L. (1988). Photosynthetic efficiency and phytochrome photoequilibria determination using spectral data. Transactions of the ASAE, 31(6), 1882-1889.
- Stanghellini, C. (1987). Transpiration of greenhouse crops: an aid to climate management (Doctoral dissertation, Wageningen University).